In this course, we have often used libraries to sample random variables
import numpy as np
[...]
ramdom_exp_values = np.random.exponential(my_lambda)
ramdom_normal_values = np.random.normal(average,std)
Inversion transform sampling method
Wikipedia example for exponential distribution $P(X \leq x) = F_{X}(x)=1-e^{-\lambda x}$ with inverse $x=F_X^{-1}(r)=-{\frac {1}{\lambda }}\ln(1-r)$:
Any probability distribution $$𝑃(𝑌)$$ can be described as the data generated by the inverse transform sampling
$$𝑌=F_Y^{-1}(U),$$
where
$$F_Y^{-1} \text{ is a deterministic function}$$
and $$U∼\text{Uniform}(0,1)$$ is some independent uniform random noise.
Notation: $a \sim b$ means $a$ is "sampled from distribution" $b$
Consider the following supervised learning task. Doctors prescribe two different treatments (A and B) to patients with kidney stones. Our goal is to predict which treatment we should ascribe to a patient (even a Na ̈ıve Bayes classifier can do this simple task). Let $X \in \{A,B\}$ denote the prescribed treatment. And let $Y \in \{0, 1\}$ be the success (1) or failure (0) of the treatment. In our dataset, we have 700 patients ascribed treatment, equally balanced between A and B.
Alice, the person in charge of applying machine learning at the hospital, investigated the data a little further and identified that doctors find treatment A more invasive and tend to only prescribe it in more severe cases. Her new data shows the following
Let $Y,T,S \in \{0,1\}$ be three binary random variables.
Consider the following interpretation.
Suppose we use hospital information as training data for our statistical model: $\mathcal{D}=\{(y_i,t_i,s_i)\}_{i=1}^{n}$ for each patient $i$.
The chain rule of probability) states $$ P(A,B) = P(A|B)P(B) = P(B|A)P(A).$$
Hence, the joint probability distribution of $(Y,T,S)$ is $$ P(Y,T,S) $$ and can be decomposed as $$ P(Y|T,S)P(T|S)P(S) $$ or $$ P(S|Y,T)P(Y|T)P(T) $$ or $$ P(S|T,Y)P(T|Y)P(Y) $$ or ...
A joint probability distribution is simply a way to assign probabilities to joint events
We should never use conditional distributions to interpret how the data was generated.
Q: Why?
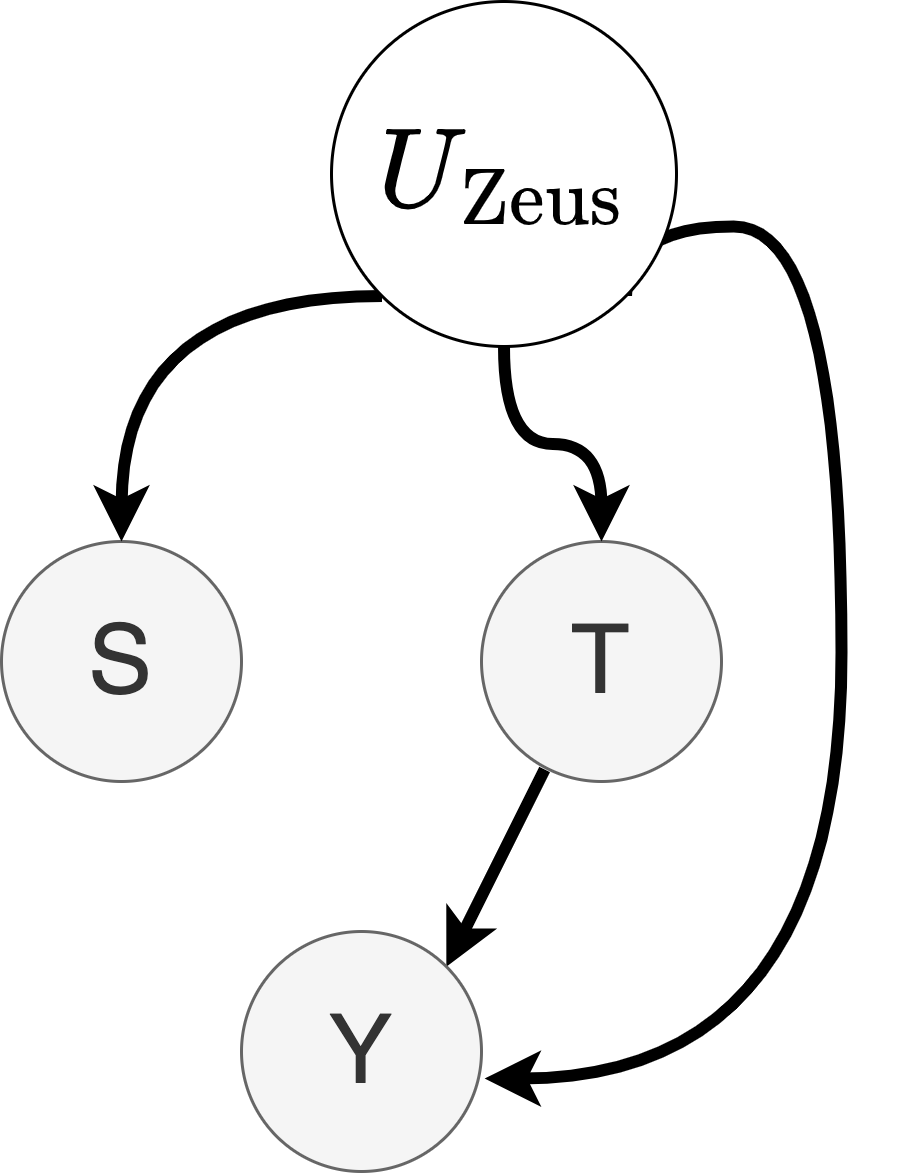
A: Because for any of the following data generation processes describes the training data equally well:
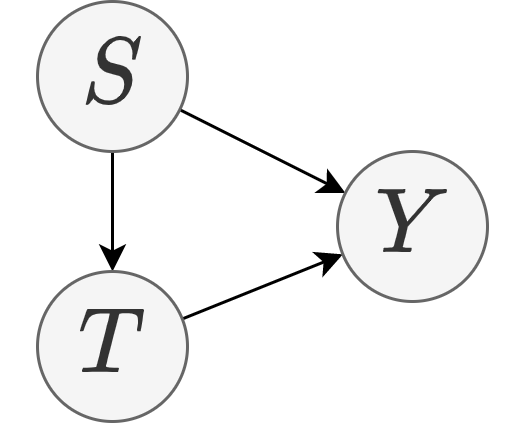
where $U_S, U_T, U_Y \sim \text{Uniform}(0,1)$ are uniform variables sampled indepedently.
where $U_S, U_T, U_Y \sim \text{Uniform}(0,1)$ sampled indepedently.
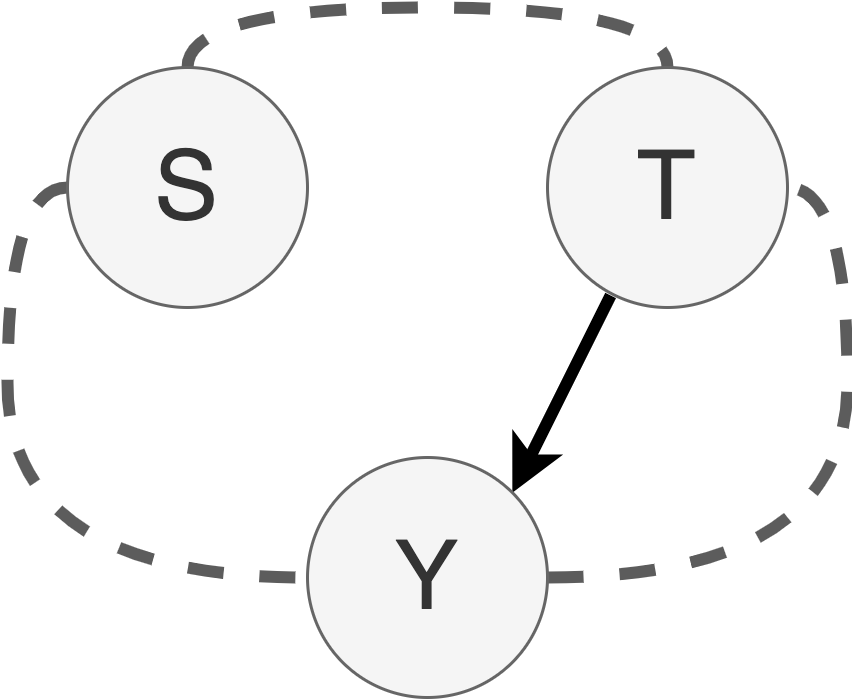
Hence, we cannot predict what happens if we force $T = A$ in the data generation process (force treatment to be "A"): $$ P(Y,S|do(T=A)) $$
do()
notation: The DO notation asks what would happen if we forced a variable to have a certain value. This is the notation developed by Judea Pearl.Alternative notation: An alternative notation for $P(Y,S|do(T=A))$ is $$ P(Y(T=A),S) $$ which is the notation used by Guido Imbens.
the "do" operation is forcing $T=A$, hence the data is generated as $$\begin{align} S&=F^{-1}_S(U_S),\\ T&=A,\\ Y&=F^{-1}_Y(T,S,U_Y).\end{align}$$
In a different data generation process, the "do(T=A)" operation gets the following data $$\begin{align} T&=A,\\ S&=F^{-1}_S(T,U_S),\\ Y&=F^{-1}_Y(T,S,U_Y).\end{align}$$
In yet another data generation process, the "do(T=A)" operation gets the following data $$\begin{align} T&=A,\\ S&=F^{-1}_S(U_S),\\ Y&=F^{-1}_Y(T,S,U_Y).\end{align}$$
Q: Which data generation process is more likely to describe our hospital data?
In our data, we found that given treatment B ($T=B$), patients are more likely to recover ($Y=1$) than with treatment $T=A$: $$ P(Y=1|T=B) > P(Y=1|T=A) $$
Is the above enough evidence to say that treatment B is better than A?
The "Simple Statistical Model" fallacy
We could describe the data generation process of this problem using the following random variables:
The above data generation can be described by an execution graph, called the causal Directed Acyclic Graph (DAG):
kidney stone size
($S$) is a confounder variable, which is a common cause for both Treatment $T$ and outcome $Y$Another data generation process for $P(Y,T,S)$:
$$\begin{align} S&=F^{-1}_S(U_\text{Zeus}),\\ T&=F^{-1}_T(U_\text{Zeus}),\\ Y&=F^{-1}_Y(U_\text{Zeus}),\end{align}$$where $U_\text{Zeus} \sim \text{Uniform}(0,1)$ a decision of the Greek god Zeus.
Q: From data alone, can we tell which data generation process is the correct one?
No. From data alone, we cannot tell which data generation process is the correct one
Structural Causal Modeling
Structural Causal Modeling (SCM) is a formal way to describe what we know about the data generation process.
What happens with $T$ if we force $do(T=B)$, i.e., we "force" treatment B on patients (regardless of their kidney stone condition).
Consider the SCM:
$$\begin{align} S&=F^{-1}_S(U_\text{Zeus}),\\
T&=F^{-1}_T(U_\text{Zeus}),\\
Y&=F^{-1}_Y(U_\text{Zeus}),\end{align}$$
where $U_\text{Zeus} \sim \text{Uniform}(0,1)$ a decision of the Greek god Zeus.
Now let's see what happens to $Y$ if we set $do(T=B)$: $$\begin{align} S&=F^{-1}_S(U_\text{Zeus}),\\ T&=B,\\ Y&=F^{-1}_Y(U_\text{Zeus}).\end{align}$$
Q: Under this data generation process, does forcing treatment B changes the probability of a favorable outcome?
A: No.
Q: Could forcing treatment B (that is, $do(T=B)$) change the probability of patient outcome?
$$\begin{align} S&=F^{-1}_S(U_\text{Zeus}),\\ T&=B,\\ Y&=F^{-1}_Y(T,U_\text{Zeus}).\end{align}$$A: Yes.
(Galles & Pearl (1998)) shows that any data generation process can be described through a causal DAG.
A simple way to describe the above data generation process is through its "execution" graph (Causal DAG):
Example of the Causal DAG from $$\begin{align} S&=F^{-1}_S(U_\text{Zeus}),\\ T&=F^{-1}_T(U_\text{Zeus}),\\ Y&=F^{-1}_Y(T,U_\text{Zeus}).\end{align}$$
We could also include all variables in the causal DAG:
(Galles & Pearl (1998)) shows that any data generation process can always be represented by a DAG:
U = np.random.uniform(0,1)
Chiken = F_Chiken(Egg, U)
Egg = F_Egg(Chiken, U)
U_Dino = np.random.uniform(0,1)
Dinosaur = F_Dino(U_Dino)
U = np.random.uniform(0,1)
Egg = F_Egg(Dinosaur, U)
Chiken = F_Chiken(Egg, U)
Goal: We want to predict $P(Y|\text{do}(X=x))$
Causal Adjustment Formula (Adjustment for Direct Causes, Theorem 3.2.2 of (Pearl 2009)):
Causal Adjustment Formula Example:
S = Kidney stone size Let's assume the following causal DAG:
$P(Y=1|T=A)= 0.78$
From cnn.com:
In February 2021, Zillow appeared so confident in its ability to use artificial intelligence to estimate the value of homes that it announced a new option: for certain homes, its so-called "Zestimate" would also represent an initial cash offer from the company to purchase the property.
The move, touted by a company executives at the time as "an exciting advancement," was intended to streamline the process for homeowners considering selling to Zillow as part of its home-flipping business. Zillow promoted this option as a way to make it convenient to sell a home while minimizing interactions with others during the pandemic. Just eight months later, however, the company is shutting down that business, Zillow Offers, entirely.
The decision, announced in early November 2021, marks a stunning defeat for Zillow. The real estate listing company took a \$304 million inventory write-down in the third quarter, which it blamed on having recently purchased homes for prices that are higher than it thinks it can sell them. The company saw its stock plunge and it now plans to cut 2,000 jobs, or 25\% of its staff.''
Modeling: